TurboDA
0,00  0

Cart

No products in the cart.
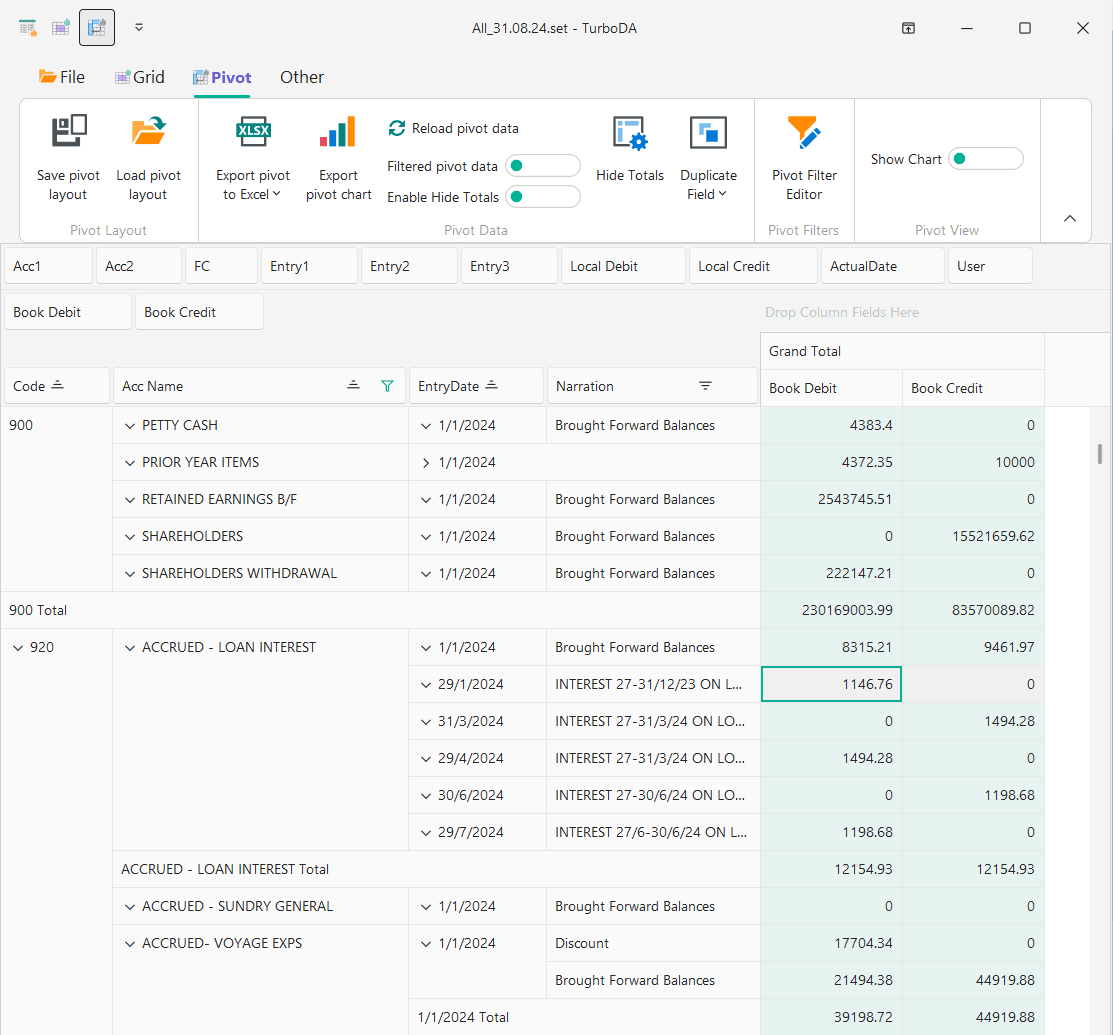
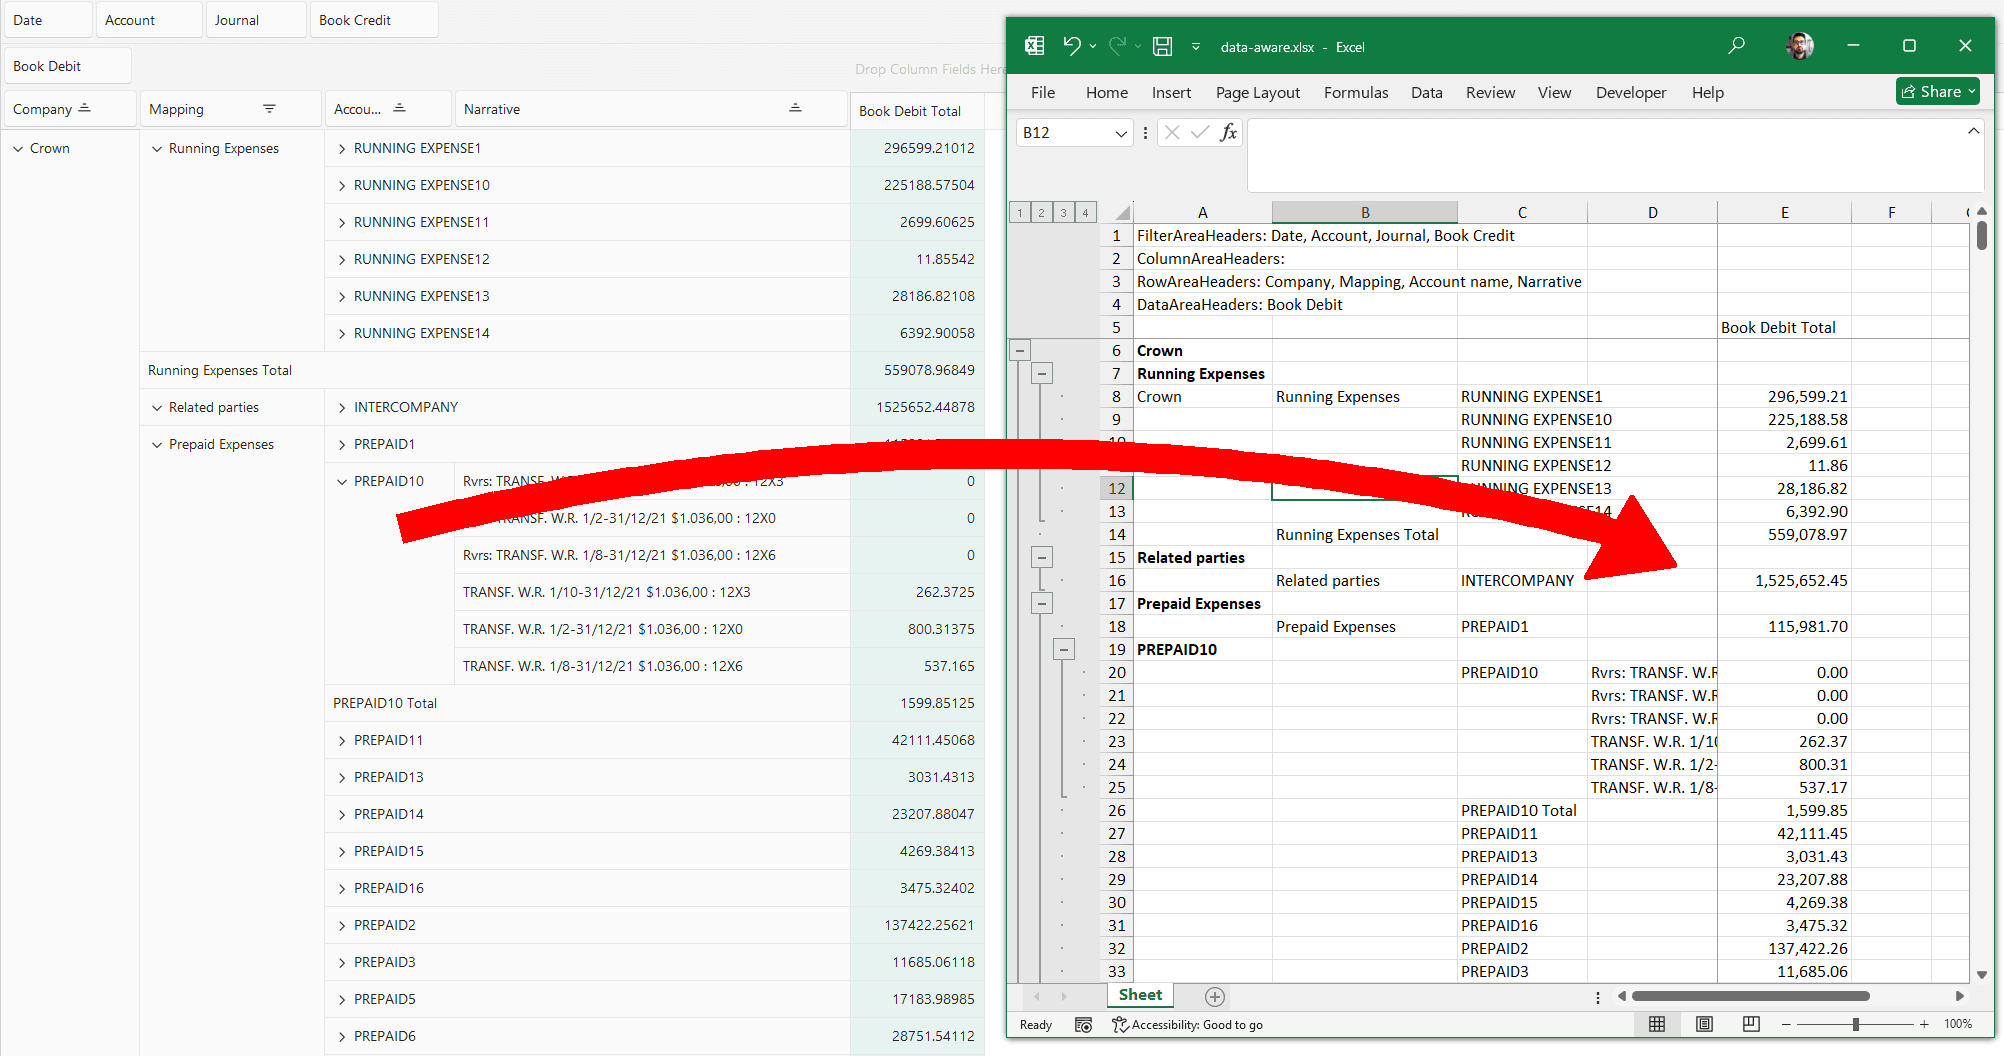
Continue shopping

TurboDA Features

Combine the power of a database with the familiarity of excel

You might have been there:

Whether you are a geneticist or a CFO, the problem remains the same: you want to quickly conclude on the true meaning of your data.
This is where TurboDA comes into play. To let you quickly and easily analyze raw data.

No server needed

Does not require expensive hardware to run on. Heck, it does not even require Office installed!

Complete Transparency

Nothing is uploaded anywhere. No adware, no external connections apart from an update check. No services are installed and does not run anything in the background.

WYSIWYG Exporting

Export easily your current layout to excel. Can export charts in image format.

Save multiple layouts

Save multiple report layouts for the same data. Easilty import new data and load your layouts for instant reporting!

Try and see! After working a few days with turboDA, you will find working in excel difficult!

Let's talk numbers

What are the companies worldwide reporting about data analytics?
Enterprise data remaining unused
70%
View real-time data analysis as critical
70%
Better competitive positioning through analytics
65%
Data analytics improves decision-making speed
60%
Average cost reduction with data-driven decisions
10%

Features at a glance

Discover the main TurboDA features by capability category:
Import Wizard

Import Wizard

Easily import tabular data of any kind in excel or csv format. Select the file and specify basic import settings, then proceed to the next step.

Define your scema

Include or exclude columns, rename them and select their type. The app automatically detects data types and preselects them for you. Preview the import result. If you are happy, save the settings you made for future imports of similar data.

Handle import gracefully

Once your data is ready to import, you select how existing data will be treated. You can merge with current data or overwrite it, and clear the existing columns or keep them.
Grid View
Ribbon UI
Filter Editor
Filter Editor
Grouping
REGEX Filters Editor
REGEX Grouping
Format Rules Editor
Expression Editor
Deduplication
Search Box

Flexible grid view

Tidy up your data , edit and color them in Drid View. The Grid offers endless capabilities to change your columns layout and formatting, sort, hide, create, and everything else you would expect from a modern data analysis tool.

Modern ribbon

All functions are neatly placed in a modern ribbon UI.

In-place editors

If you defined correct data types during import, the app will automatically display correct in-place editors for your data.

Advanced Filtering

Use advanced filters and define multiple complex rules. You can even store and restore your saved filters to other data.

Easy Grouping

Drag and drop a column header to the space above to group by that column. Make group hierarches on basic or filtered data. Expand and collapse the results. Save and restore your layout.

Regular Expression Filtering (regex)

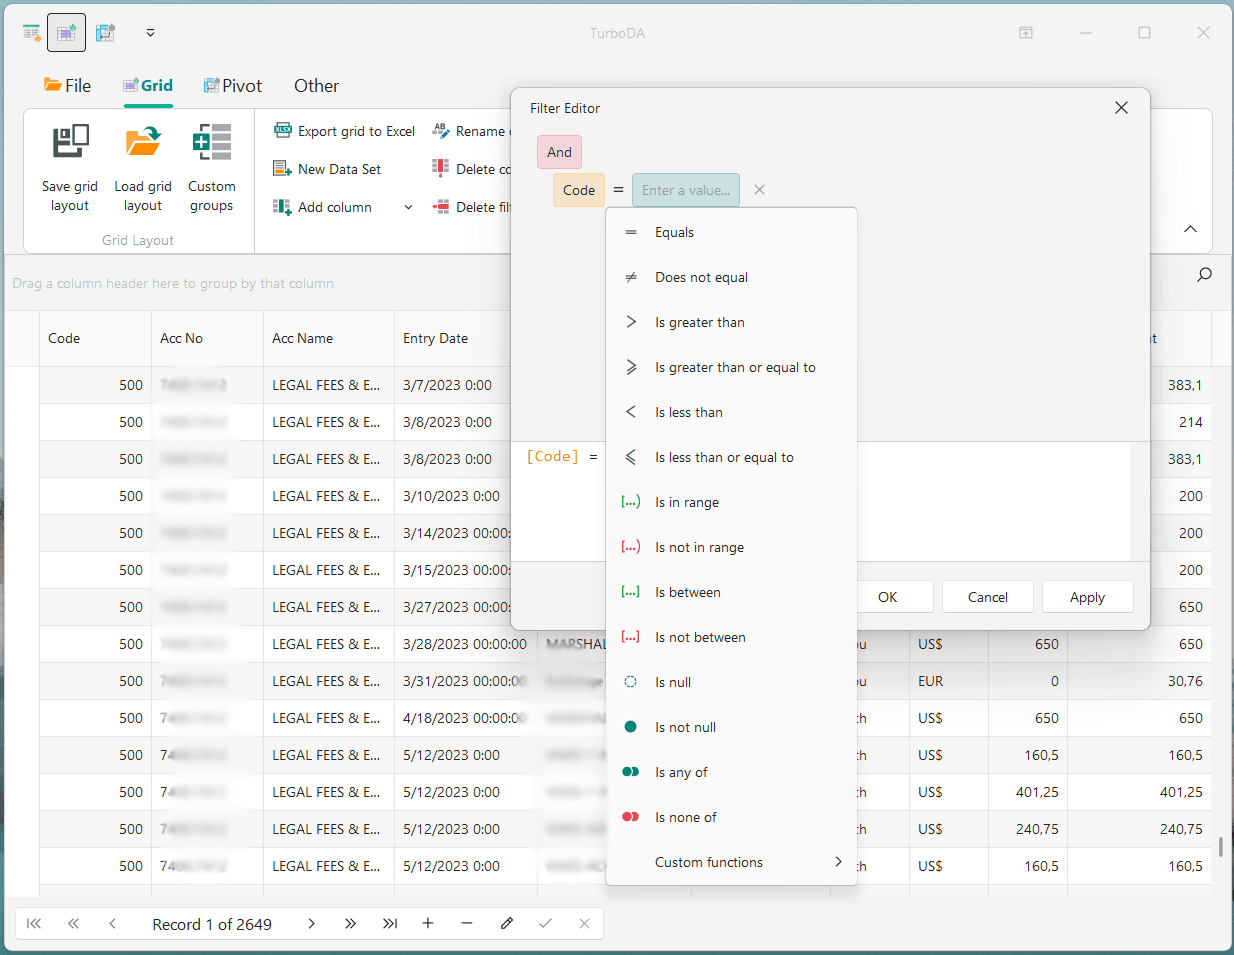
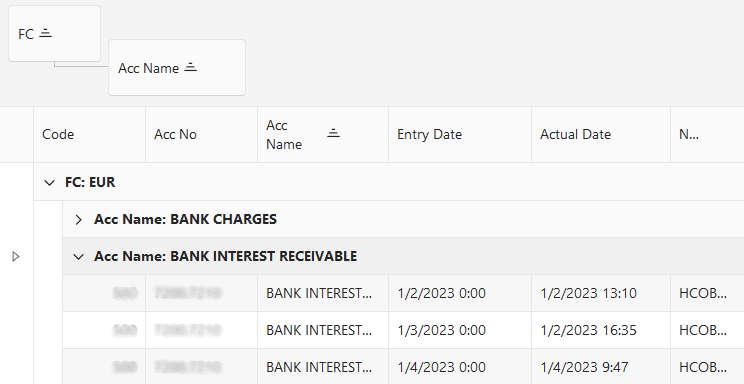
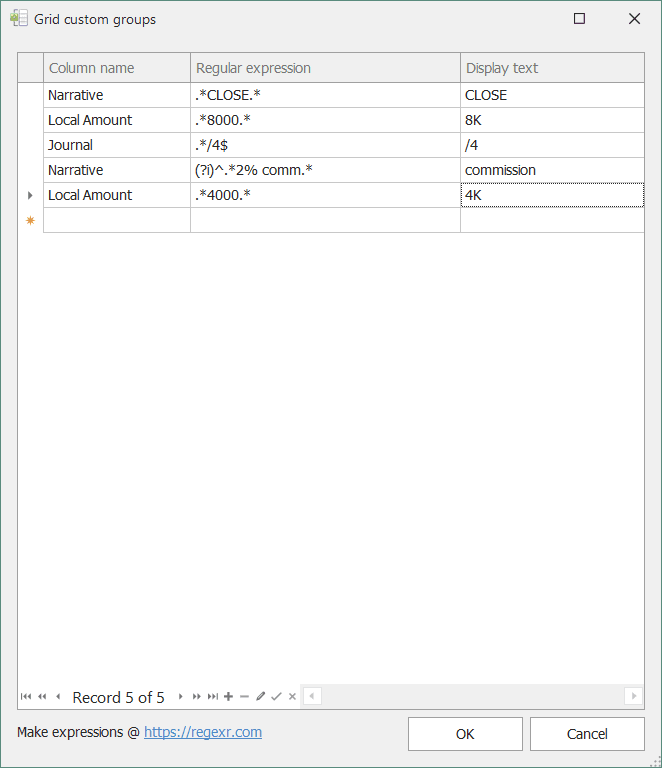
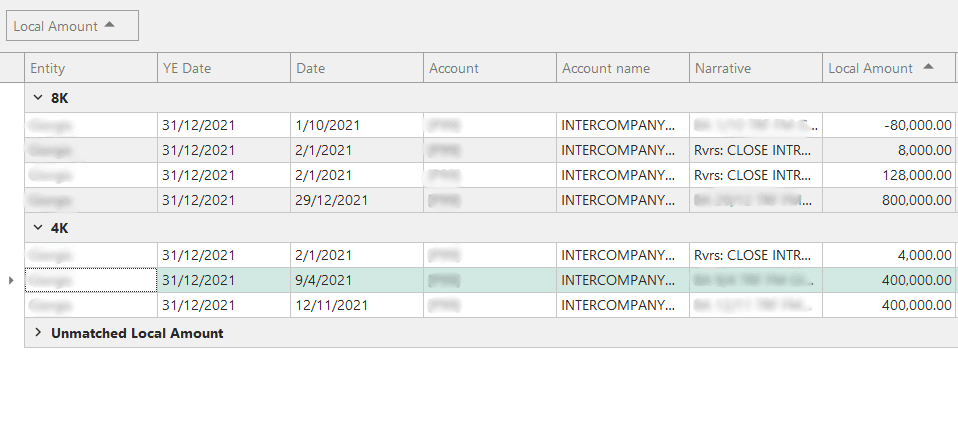
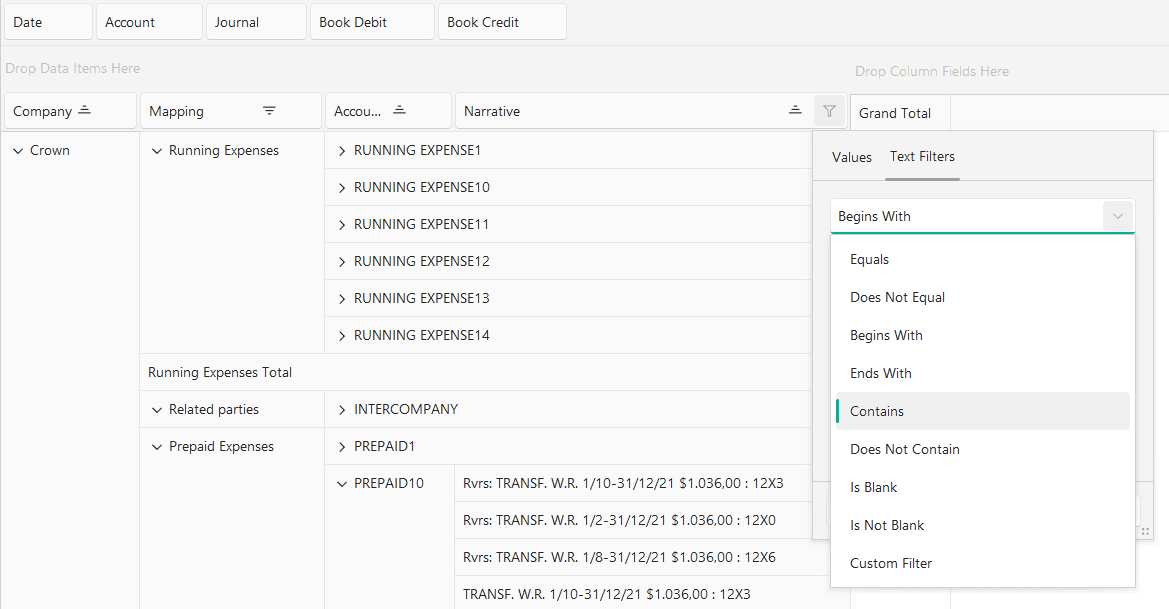
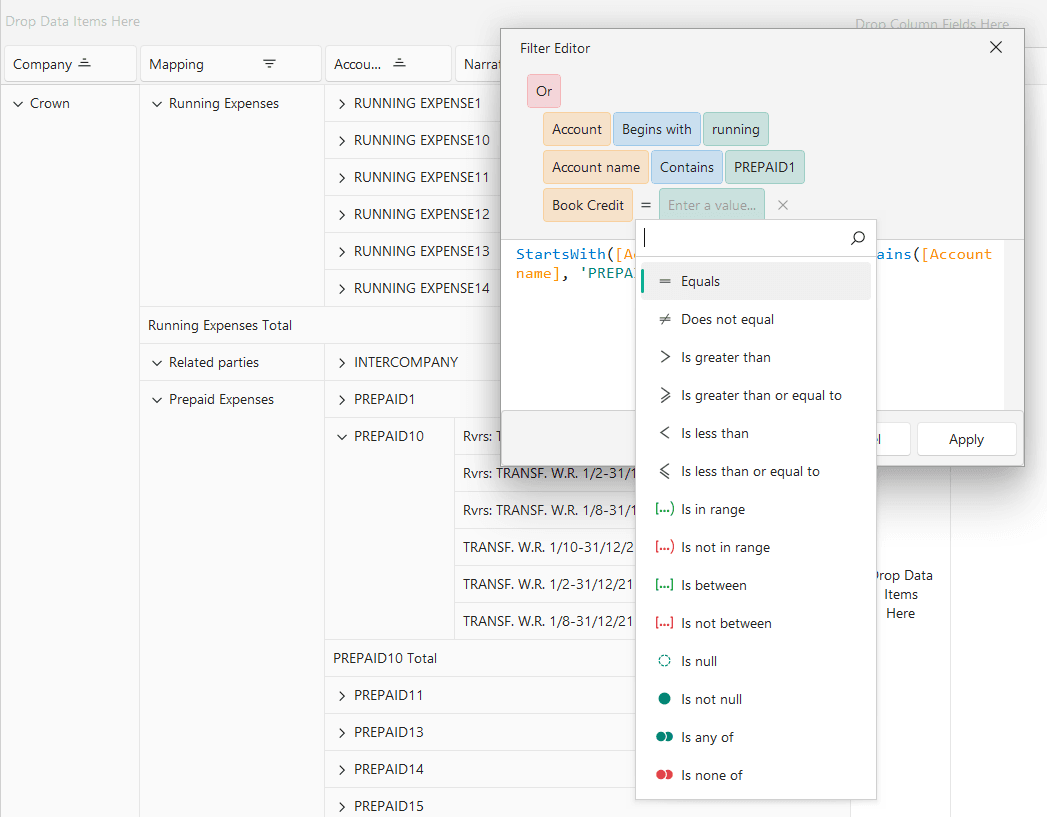
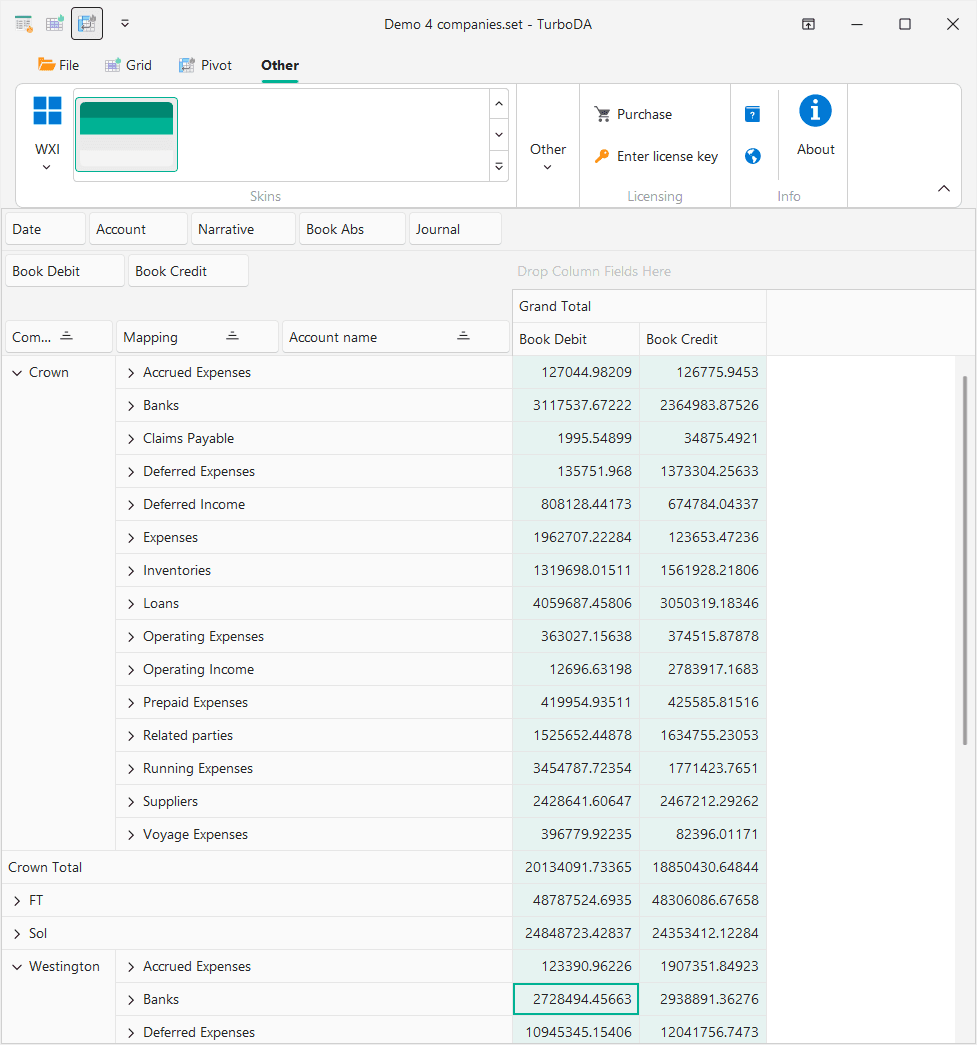
As an industry exclusive, introducing the ability to filter your data by your own regular expressions. Make extremely advanced selective or conditional filters on your data, save, share and restore them.

Conditional formatting

Format each column or line as per your specifications. Define multiple rules. Optical hints to help you sort your data.

Calculated columns

Make your own calculated columns based on advanced functions. Your calculated columns are saved in your Grid layout so you can restore them later.

Easy duplicate spot

Easily find duplicate data. Just go to the corresponding droplist and select the column to search for duplicates. All duplicates are then promptly selected.

powerful search box

Fast and ruthless search engine to find your term easily.

Powerful pivot view

The Pivot feature has the Grid as its datasource. You draw data from the Grid and drag and drop them to the desired positions. Stack multiple columns to the same position to enable drilldowns by these columns.

Modern Ribbon

Combine the power of a database with excel's pivot table. Quickly analyse and make reports. Save and restore to same or similar data.

Quick filters

Filter your data so that your report contains only what you really need with our near and easy interface.

Complex Filtering

Need complex conditional filters? No problem. Use our advanced filter editor to build your filter with multiple conditions!

Data-Aware Export

Export your report as raw data or with drill-down capabilities!

Easy Reporting features

Go to Pivot view, and drag and drop the columns of the grid to the desired analysis position. Filter data if needed. View drill downs and totals. Here you see a demo Trial Balance report, fully exportable to excel.

Design your charts

Make your charts based on the pivot grid and export them as images that can be imported elsewhere.

Change skins

Various skins from which to choose from. Every aspect of the app from main UI to simple messagebox is skinned according to your taste.

Make your own toolbar

Modify the Quick Access Toolbar to your liking and fit it to your workstyle.

Continuing updates

Continuing development, bug fixes and new features will be added.

Simple straightforward pricing

Start reporting for free, then if you're happy buy a lifetime license. No extra charges.

Lifetime License

Lorem ipsum dolor sit amet consect etur adipisicing elit. Itaque amet indis perferendis blanditiis repellendus etur quidem assumenda.
What's included
  • Free upgrades to minor versions
  • 1-year technical support
  • 1PC license. Free transfer to other PC
  • 30-day money back guarantee
Pay once, own forever

$59.90

Get free Trial
Solutions
TurboDA
Subscribe to our newsletter
The latest news, articles, and resources, sent to your inbox.

Copyright © 2025. IG. All rights reserved.

WordPress Cookie Plugin by Real Cookie Banner